| Submission Date | August 29th 2013 |
|---|---|
| Authors | |
| APIs and SDKs Used |
|
When we were envisioning ideas for a Splunk app, we knew immediately that we wanted to create something that everyone could use. We looked around our place and realized that the thing we, and many others, use most is our car.
Wouldn't it be great, we thought, if we knew what our car was doing when we drove it? Or how well do we drive day to day? That's what we set out to do with this project.
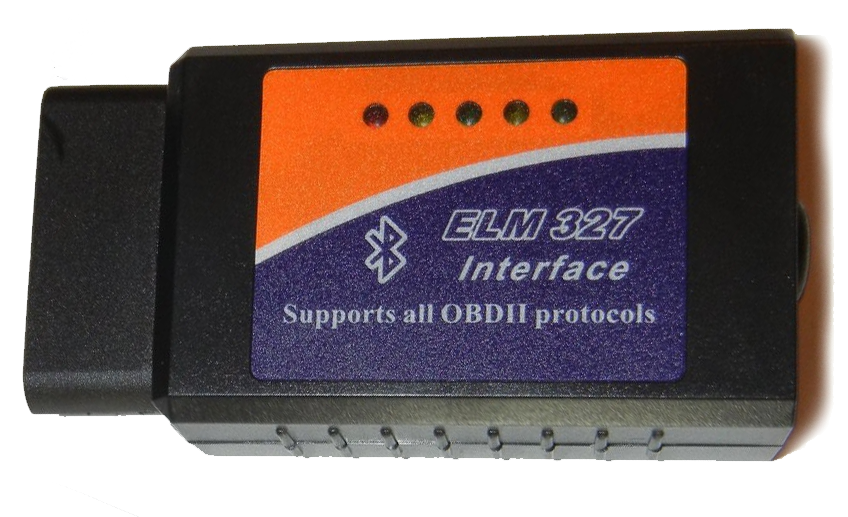
Using just an Android phone and an inexpensive OBD2 Bluetooth adapter, the Splunk for Your Car application is able to display rich information and statistics about your vehicle's trips. Unlike other "Black Box"-like loggers for your car which communicate with online services or are provided by your insurance company, since this is something you can set up yourself, you have the peace of mind that the data you're logging won't be used by a third party, possibly against you.
Your insurance company doesn't need to know where you drive. Or what neighborhoods you frequent. Or that you hit 120 MPH on the interstate at 2AM.
It's your car, your data, and your Splunk instance.
When you open up Splunk, the application opens up to a dashboard displaying your last week's worth of driving activity.
Along the top are four summarized metrics for the week's trips:
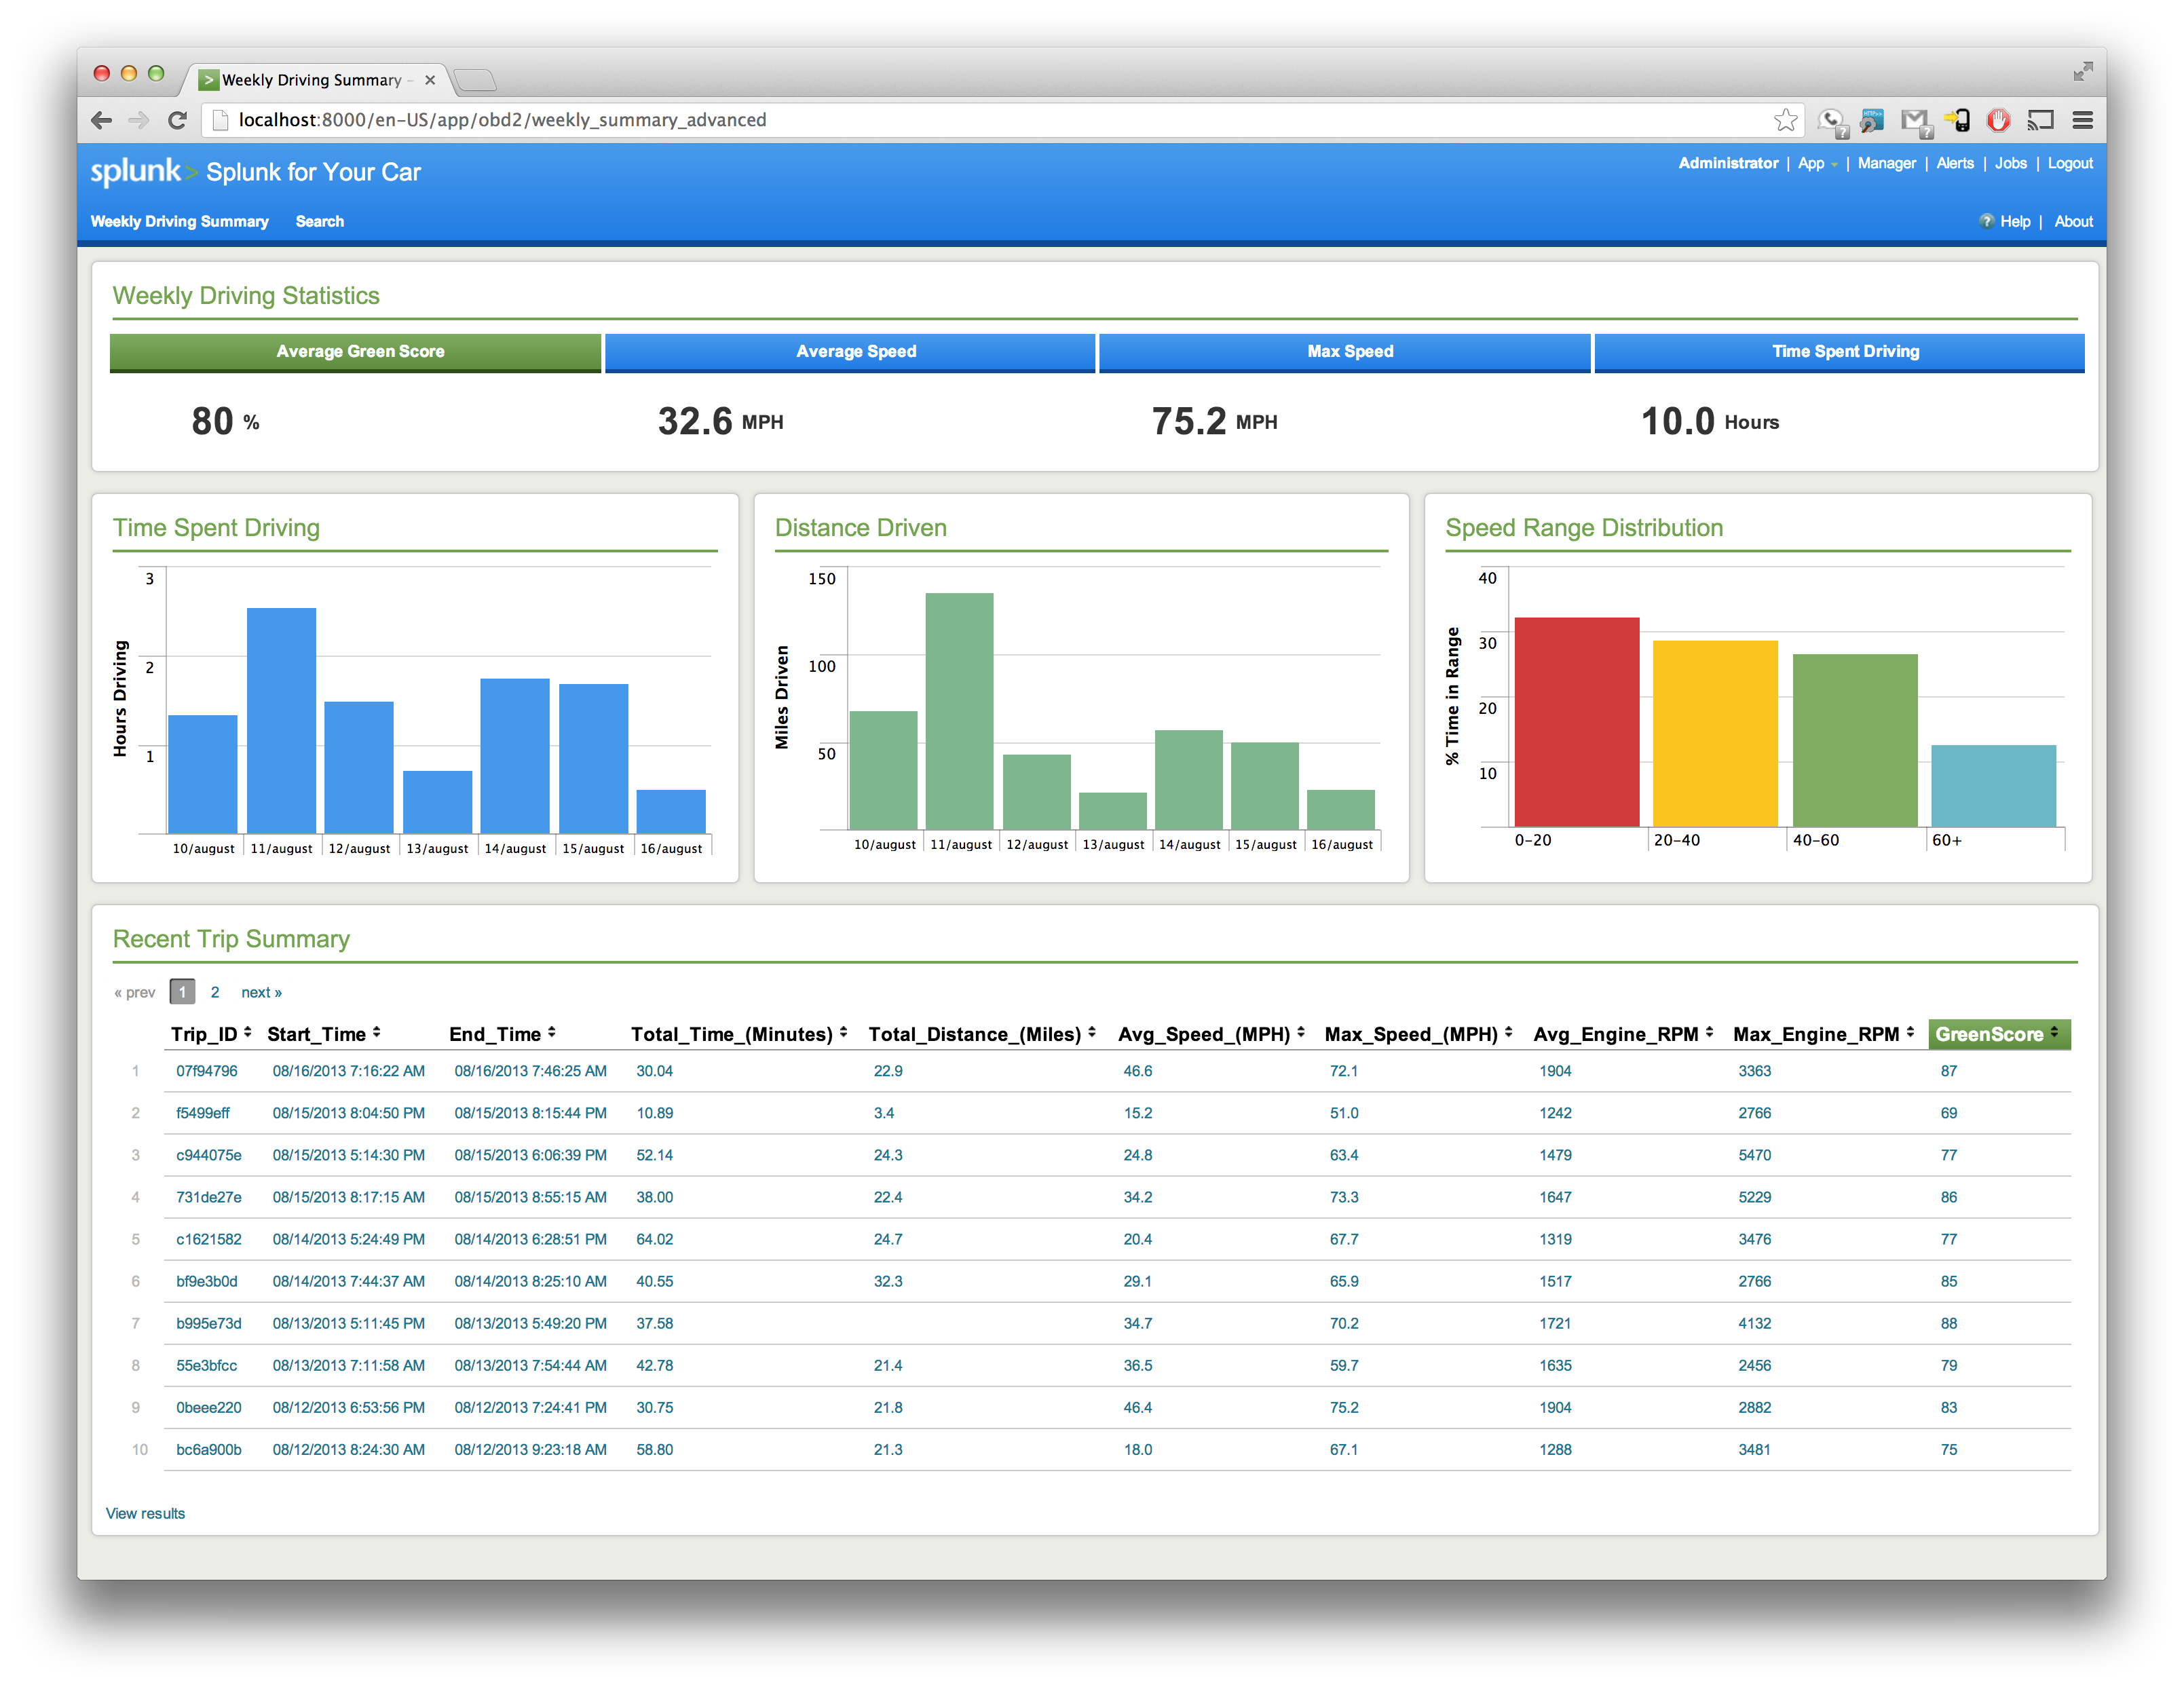
In the second row are three additional panels:
At the bottom of the dashboard is a table displaying information for all of the trips that have been logged to Splunk so far. By clicking on a row in the table, you are able to drill-down to display information about just that one trip.
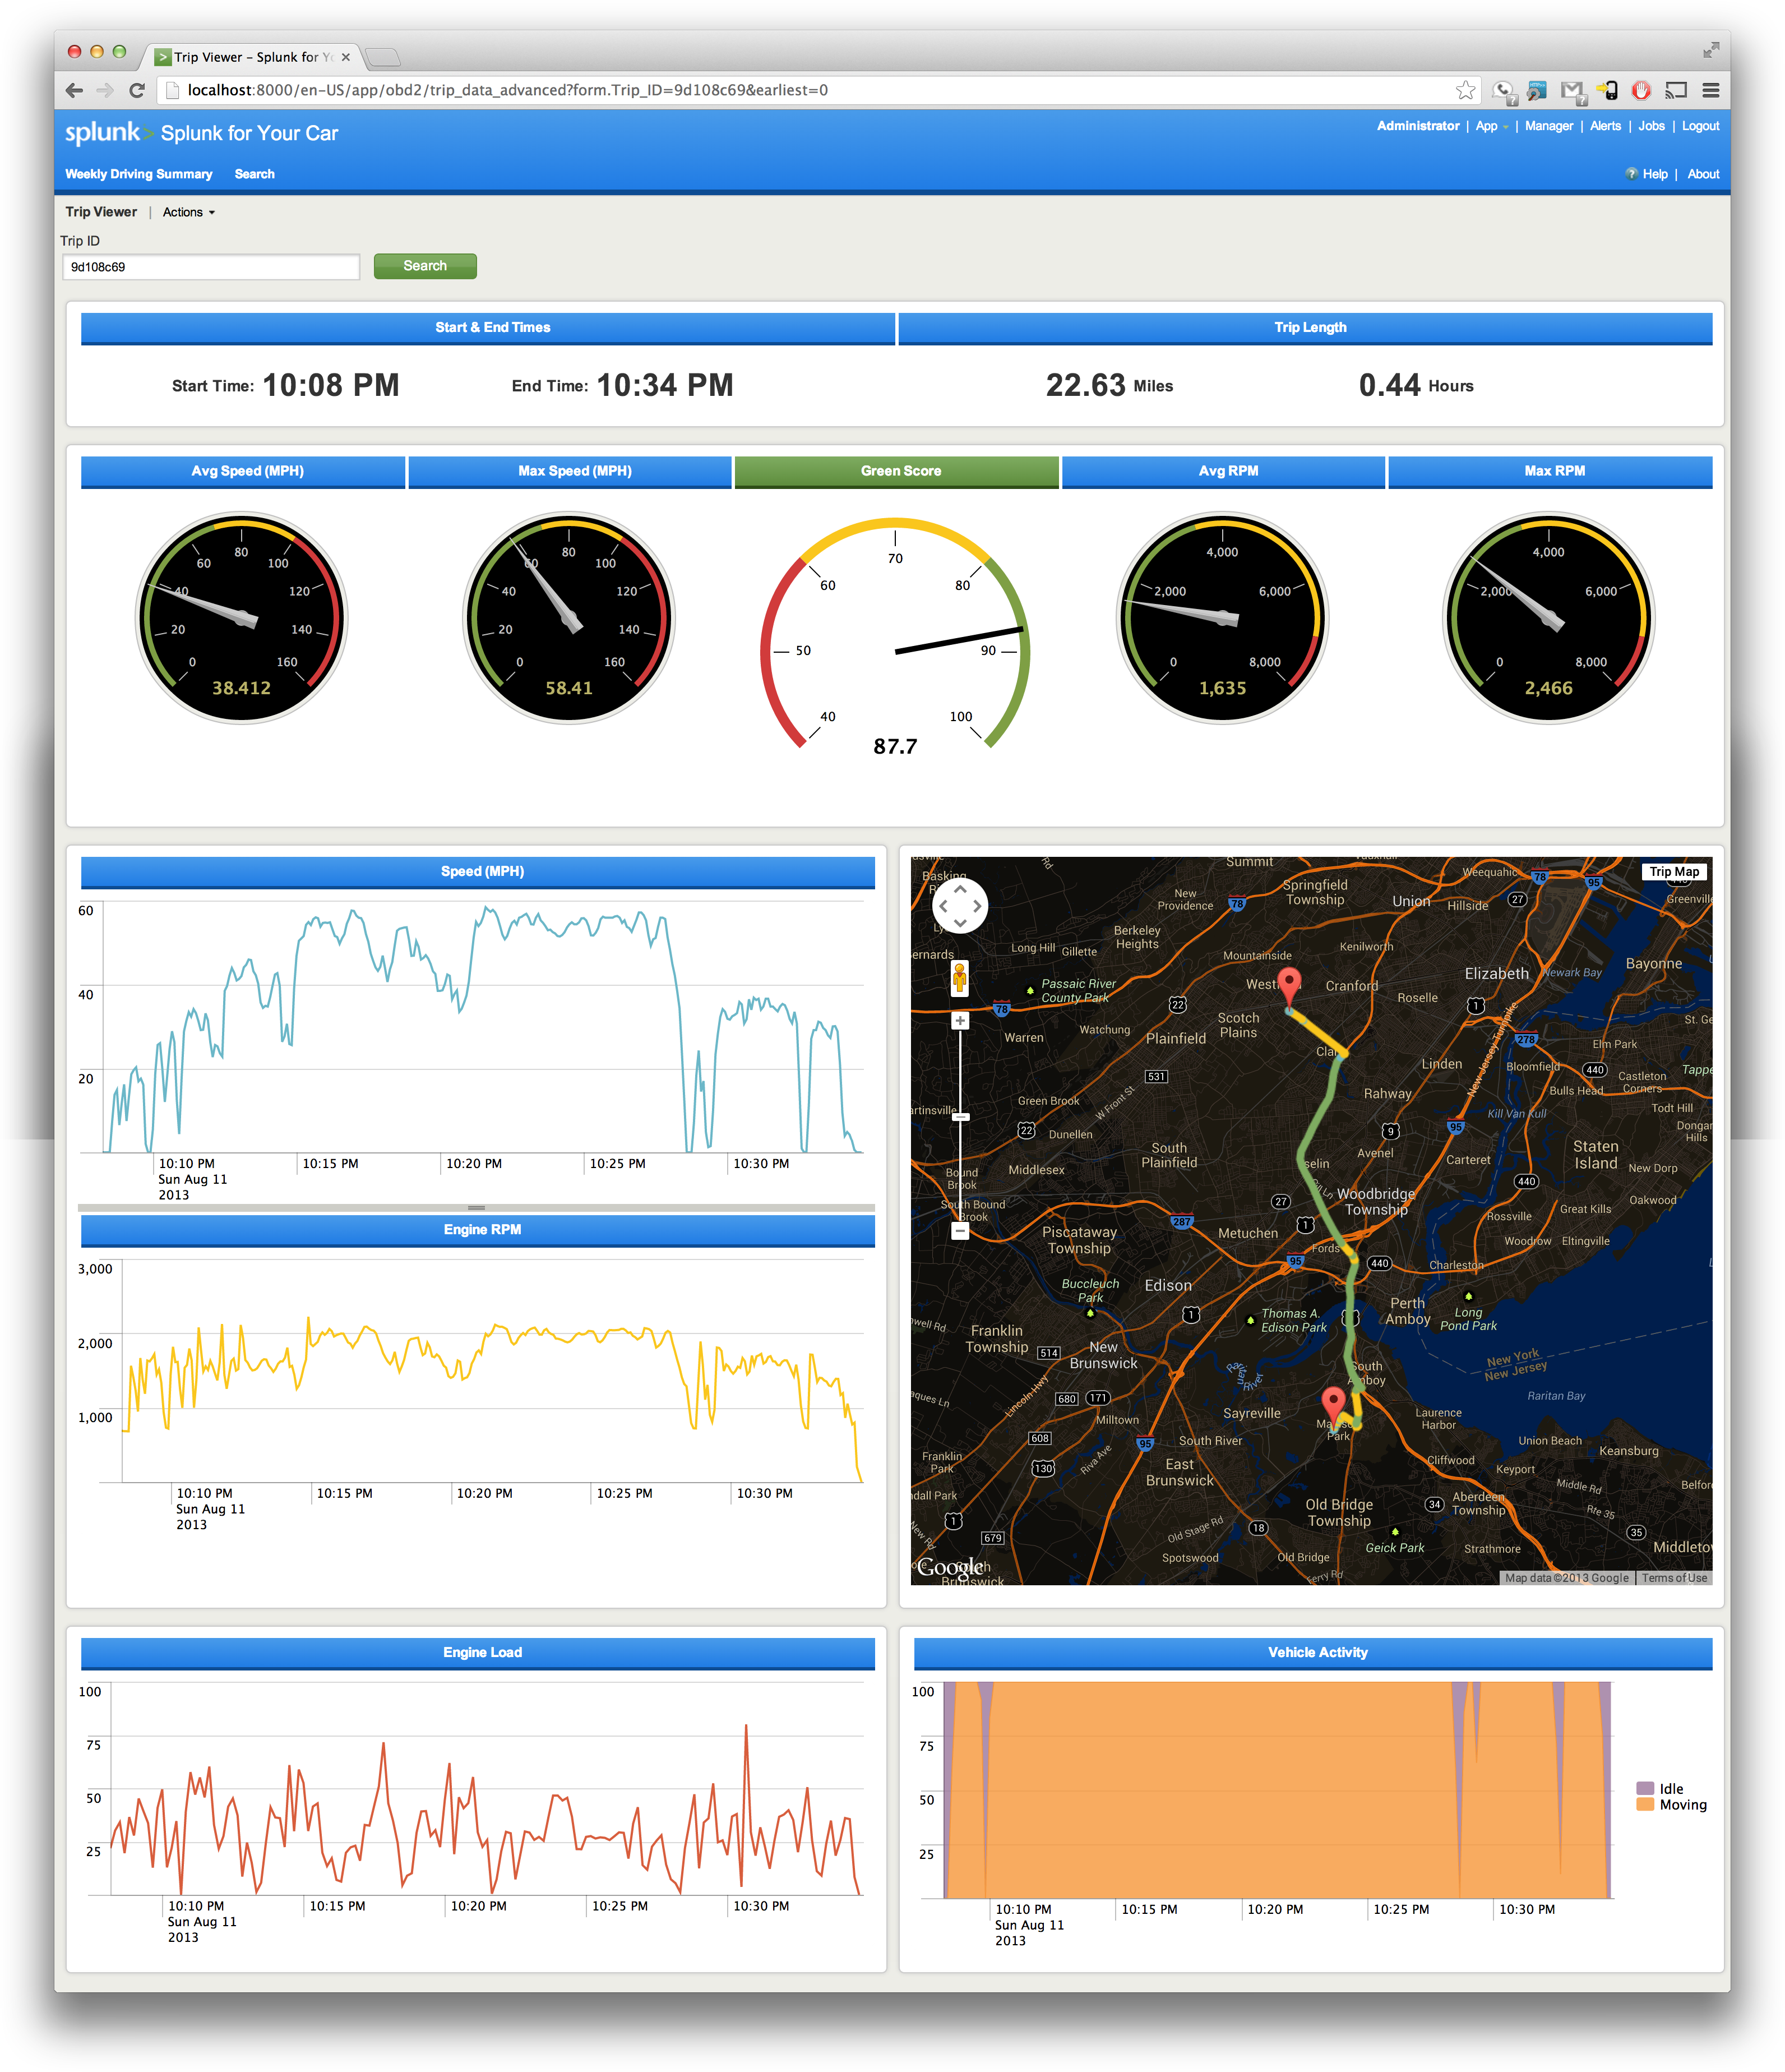
The drill-down Trip View presents you with detailed information about the logged trip.
Along the top, you're presented with the start and end times of the trip, the total distance travelled, and the amount of time spent driving.
The second row presents several gauges displaying information on the average and maximum values for the trip's speed and RPMs. In the center of this row is the Green Score achieved for the trip.
Contiuning downward are graphs displaying the vehicle's logged speed, RPMs, engine load, and activity over time.
On the right-hand side is a trip map that outlines the path followed by the vehicle over the course of the trip. The different path colors follow the same color scheme as the Speed Range Distribution chart on the Weekly Summary dashboard.
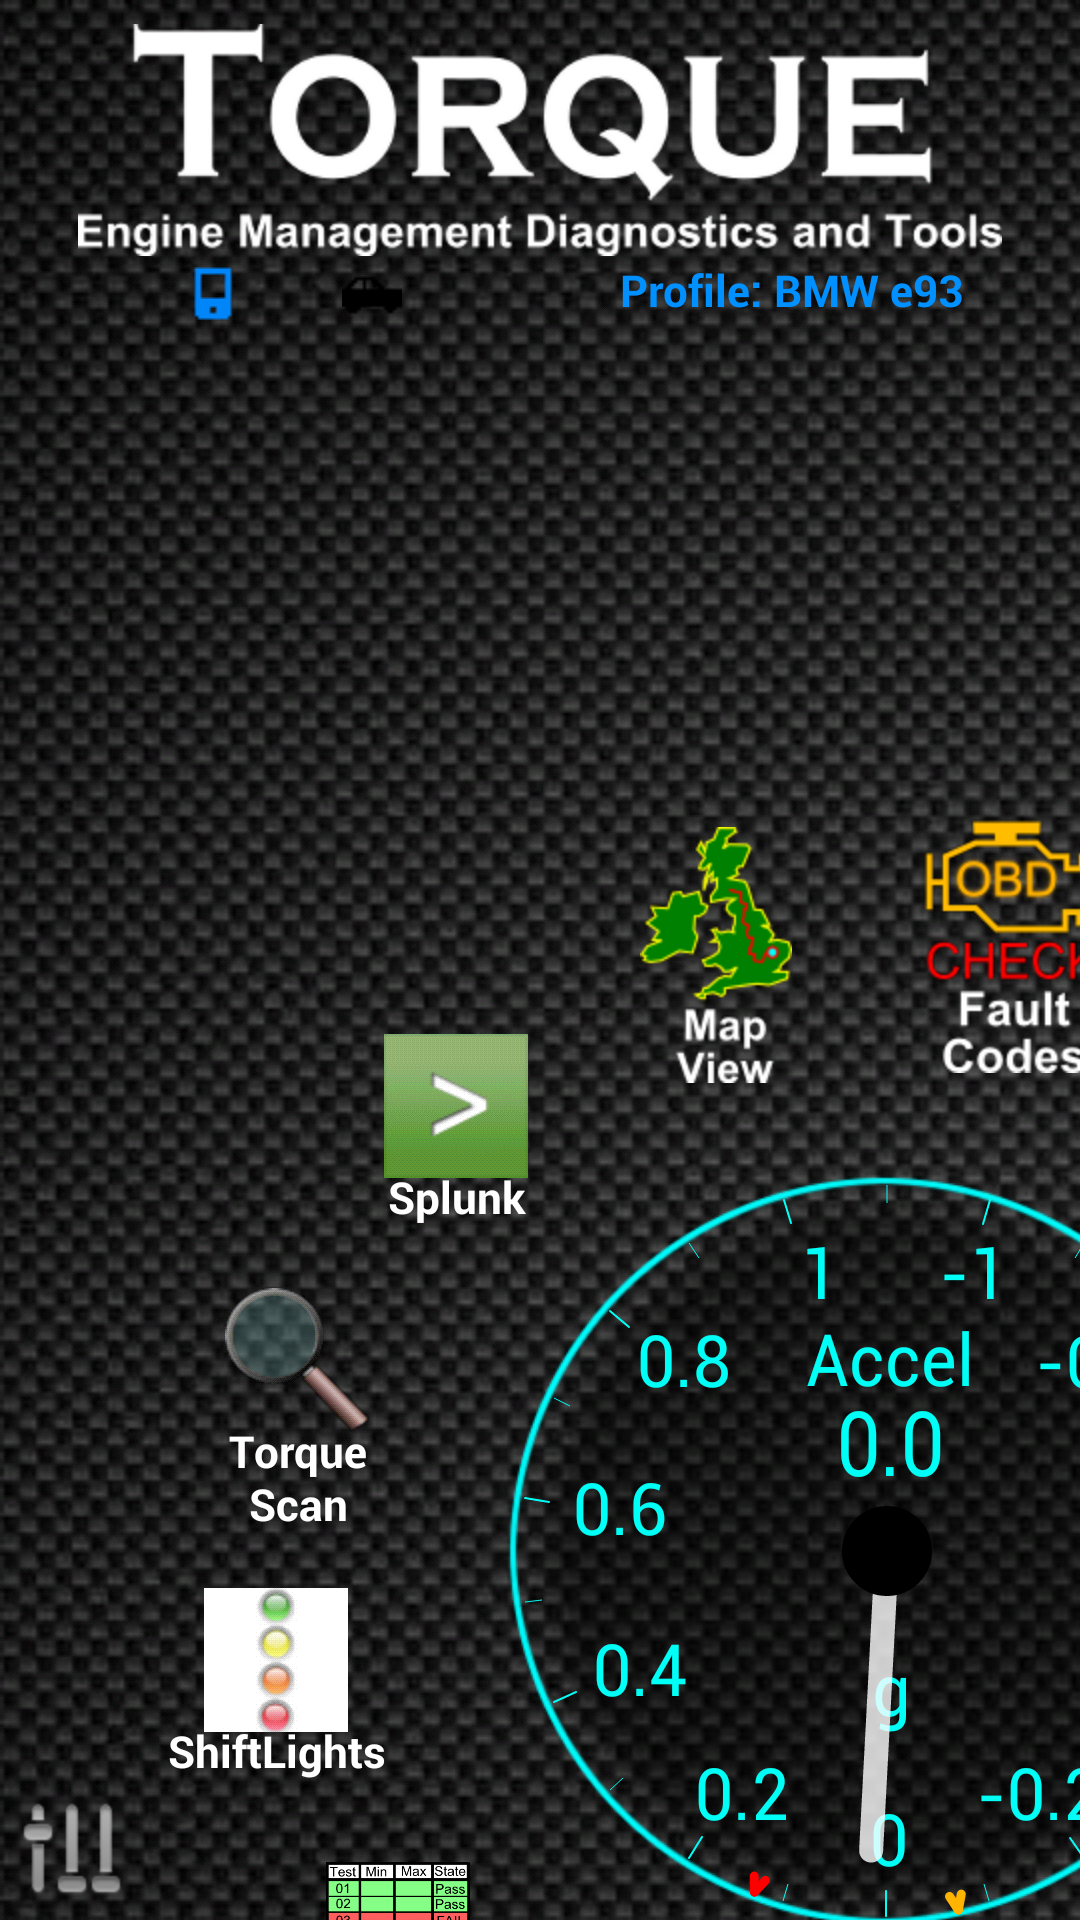
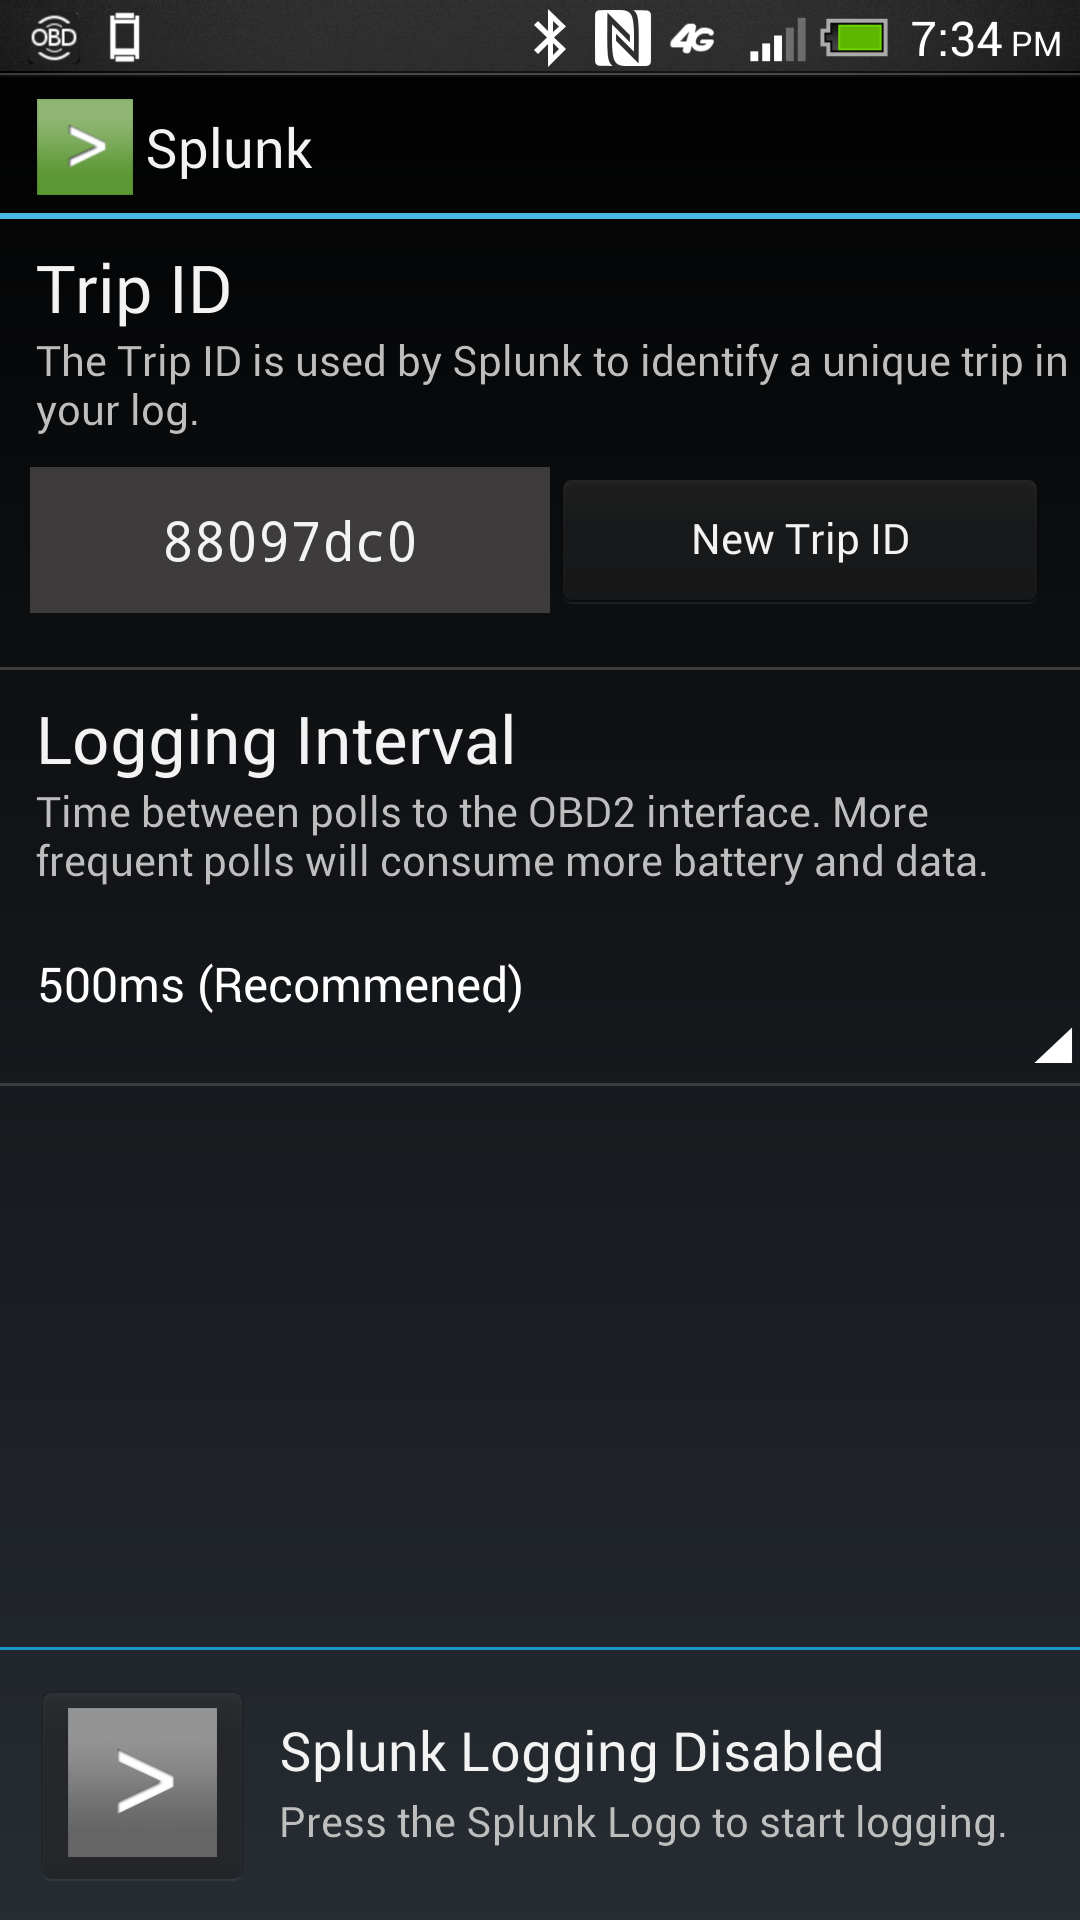
The Android SDK was used to develop a small Android App that plugs into Torque Pro's API in order to extract data coming out of the OBD2 bluetooth adapter.
The Dropbox Sync API was used within the Android app as a means of transferring data from the mobile device over to a computer running Splunk.
In order to acheive the desired look and feel of the app, of the dashboards were created using Splunk's Advanced XML dashboard markup, with additional customization done using JavaScript and CSS.
We initially attempted to use the Google Maps app found on Splunk Base, but found that it did not fullfill our needs within this application. Using Splunk's Python and JavaScript application framework, we created a new module that uses the Google Maps API to display the map as shown in the Trip View dashboard.
If you're running Splunk in your company, you most likely have a dedicated set of machines for all your Splunk-ing. However, for personal use, this isn't always feasable. If you're using a laptop as your primary home computer, there's a good chance that your Splunk instance won't be available 24/7.
However, using the Dropbox Sync API, we're able to write data from your Android device to your Dropbox account. The idea is that you can have your Splunk Indexer (any laptop or desktop running Splunk) also run Dropbox (which you're probably already doing). You then point Splunk to the directory in your Dropbox folder where the Android app is writing to.
As soon as your computer comes back online, it'll sync any new files down from Dropbox, which Splunk will then automatically index.
One of the goals we had for this project was to not only to log the car's activity, but to be able to gauge how well we were driving. For this purpose, we developed an algorithm called the "Green Score".
By looking at your Green Score for an individual trip, or your weekly average, you're able to gauge how fuel efficent your route and driving habits are.
The algorithm for the Green Score for a specific trip is as follows:
- Start with a score of 100 Points
- Subtract
avg(Engine_Load)Points- Take the length of the trip, and sub-divide it into 5% intervals (20 total sections). For each section, take the
avg(Speed), and adjust the score based on the table below:
Speed Range (MPH) Points Speed < 35 0 Points 35 < Speed < 40 +0.5 Points 40 < Speed < 50 +1 Point 50 < Speed < 60 +2 Points 60 < Speed < 70 +1 Point 70 < Speed < 80 0 Points 80 < Speed < 90 -1 Point 90 < Speed < 100 -2 Points Speed > 100 -5 Points
Using Engine Load as a base for the score penalizes the final score appropriately since the load on the engine is dependant on the driver's driving style (light vs heavy foot), and the route's terrian (uphill, flat, downhill, etc). Points are then awarded back based on how often you were in certain speed categories throughout the trip. This allows for then rewarding the driver back some points if he or she is driving at a speed where the vehicle's aerodynamics are most in its favor.
Torque Pro, an Android app by Ian Hawkins, provides an excellent visualization of the real-time data that is coming out of your car's OBD2 port. The app also provides a plugin API that allows a developer to write an Android application that can attach to the same data source the Torque Pro app sees.
Using this plugin API, we wrote our own mini Android app that logs the real-time data in a Splunk-friendly format, as shown below.
2013-08-16 17:12:41.457 [1612 trip_uuid=0051710e] pid="12" pid_name="Engine RPM" Engine_RPM="1579.0" units="rpm"
2013-08-16 17:12:41.457 [1612 trip_uuid=0051710e] pid="13" pid_name="Speed (OBD)" Speed__OBD="13.0" units="km/h"
We're currently utilizing the Dropbox Sync API as previously mentioned, but the app was architectured in a way that it could easily log to the SD Card or to a REST API (yes, we tested with Splunk Storm's REST API - it works!).
Below is a list of some the PIDs being collected and logged to Splunk.
| pid | pid_name | units |
|---|---|---|
| 4 | Engine Load | % |
| 12 | Engine RPM | rpm |
| 13 | Speed (OBD) | km/h |
| 15 | Intake Air Temperature | °C |
| 16 | Mass Air Flow Rate | g/s |
| 17 | Throttle Position(Manifold) | % |
| 47 | Fuel Level (From Engine ECU) | % |
| 69 | Relative Throttle Position | % |
| 16715777 | Speed (GPS) | km/h |
| 16715781 | GPS Longitude | ° |
| 16715782 | GPS Latitude | ° |
| 16715783 | GPS Bearing | |
| 16715792 | GPS Altitude | m |
| 16716289 | Miles Per Gallon(Instant) | mpg |
| 16716292 | Trip Distance | km |
From the start, we knew this project was going to be a learning expirence, no matter what the outcome.
We learned....